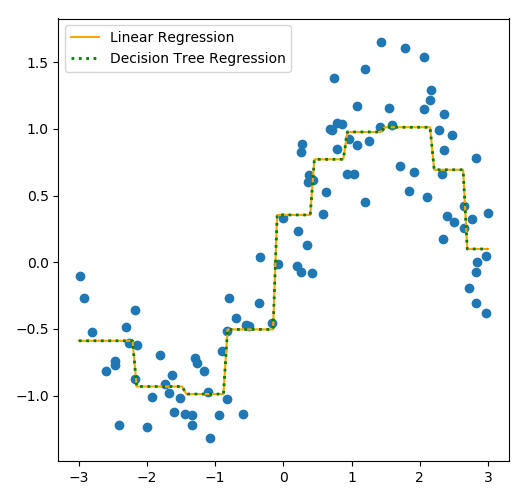
前文介绍了多项式回归的方式,来提升非线性数据在线性回归模型上的表现,本文介绍另一种重要方法,对数据进行分箱,也就是离散化。与线性回归相比,我们常用的一种回归是决策树回归,但决策树回归非常容易过拟合,而分箱就是非常好的一种防止过拟合,提高模型泛化能力的方法。

下面我们依然用多项式拓展例子中的sin曲线数据,来先做分箱操作,在对数据进行线性回归和决策树回归拟合。
代码示例
1、生成数据集
import numpy as np

rnd = np.random.RandomState(24)
x_rnd = rnd.uniform(-3, 3, size=100)
y = np.sin(x_rnd) + rnd.normal(size=len(x_rnd)) / 3

x = x_rnd.reshape(-1, 1)
2、线性回归和决策树回归
from sklearn.tree import DecisionTreeRegressor as DTG
from sklearn.linear_model import LinearRegression as LR

line = np.linspace(-3, 3, 100).reshape(-1, 1)

# 线性回归
lr = LR()
lr.fit(x, y)
y_lr = lr.predict(line)

# 决策树回归
dtg = DTG()
dtg.fit(x, y)
y_dtg = dtg.predict(line)
3、分箱
from sklearn.preprocessing import KBinsDiscretizer

# 分10箱,用onehot编码
enc = KBinsDiscretizer(10, encode='onehot')
x_bins = enc.fit_transform(x, y)
# 测试集分箱
line_bins = enc.transform(line)

# 线性回归
lr_ = LR()
lr_.fit(x_bins, y)
y_lr_ = lr_.predict(line_bins)

#决策树回归
dtg_ = DTG()
dtg_.fit(x_bins, y)
y_dtg_ = dtg_.predict(line_bins)
4、画图
from matplotlib import pyplot as plt

fig, (ax1,ax2) = plt.subplots(1, 2, figsize=(10, 5), sharey='row')

ax1.scatter(x_rnd, y)
ax1.plot(line, y_lr, c='orange', label='Linear Regression')
ax1.plot(line, y_dtg, c='green', label='Decision Tree Regression')
ax1.legend()

ax2.scatter(x_rnd, y)
ax2.plot(line, y_lr_, c='orange', label='Linear Regression')
ax2.plot(line, y_dtg_, c='green', linestyle=':', linewidth=2, label='Decision Tree Regression')
ax2.legend()

plt.tight_layout()
plt.show()
由对比图可以看出,分箱后不管是线性回归,还是决策树回归,都非常好的拟合了sin曲线,还消除了过拟合的问题。
本文为 陈华 原创,欢迎转载,但请注明出处:http://edu.ichenhua.cn/read/297
- 上一篇:
- 动态规划之钢条切割问题


